Operational Technology & IoT
Simulating industrial sensor data and deploying a real-time monitoring tool onto the production floor — because a model is only useful once it's running where the person who needs it can act on it. Part of a larger stack connecting IoT sensor data through inventory management to sales analytics.
The problem
Open source OT data is nearly impossible to find — so I generated it. The goal was to simulate what a real conveyor belt environment produces: not clean, well-behaved sensor readings, but the kind of messy, incomplete, noisy data that industrial systems actually emit.
From there, the harder question was: what do you do with it? A dataset is useless if the people who need to act on it can't read it. So the second half of this project is a dashboard built for the plant manager, not the data engineer. Machines don't just break down. They warn you first. This project is built to catch those warnings.
Generating IoT Sensor Data
Three sensor signals were simulated — bearing speed, motor temperature, and vibration levels. These are the canonical indicators of conveyor belt condition, and degradation in any one of them can signal an impending failure.
Three distinct categories of real-world data quality problems were deliberately introduced into the dataset:
- Packet loss — random gaps in the timestamp sequence, simulating network dropouts that a naive pipeline would silently misread as normal intervals.
- Sensor noise — extreme vibration spikes from electrical interference. Values that look like failures but aren't, requiring logic that distinguishes signal from noise.
- Null values — temperature sensor dropouts. A sensor going silent is a structurally different problem from one reporting a bad value, and needs different handling.
AI-Powered Plant Manager Dashboard
A real-time Streamlit dashboard built for plant floor visibility and rapid incident triage. The core visualization plots live sensor readings against a smoothed trend line—filtering out electrical noise to reveal structural mechanical degradation.
The Operational Edge: Integrated directly with anthropic (Claude-Haiku), the application features an active AI Maintenance Assistant. Instead of routing cryptic raw telemetry to a busy manager, the system parses multi-variable anomalies (speed drop + temp spike + vibration threshold breach) and translates them instantly into structured, zero-jargon field playbooks.
Running the Dashboard & AI Assistant Locally
- Ensure Python 3 is installed along with the required libraries:
streamlit,pandas,anthropic, andmatplotlib. - Set your environment variable:
export ANTHROPIC_API_KEY="your-key-here". - Clone the repo and run
streamlit run plant_dashboard.pyfrom your terminal. - The application utilizes the highly efficient
claude-haiku-4-5-20251001model to optimize SaaS API runtime speeds and lower production token unit economics. - Click the "🔍 Analyse Latest Anomaly" button on the dashboard to trigger the production prompt payload.
- Use the Smoothing Window slider on the left panel to adjust how many records are averaged to filter signal from noise in the vibration chart.
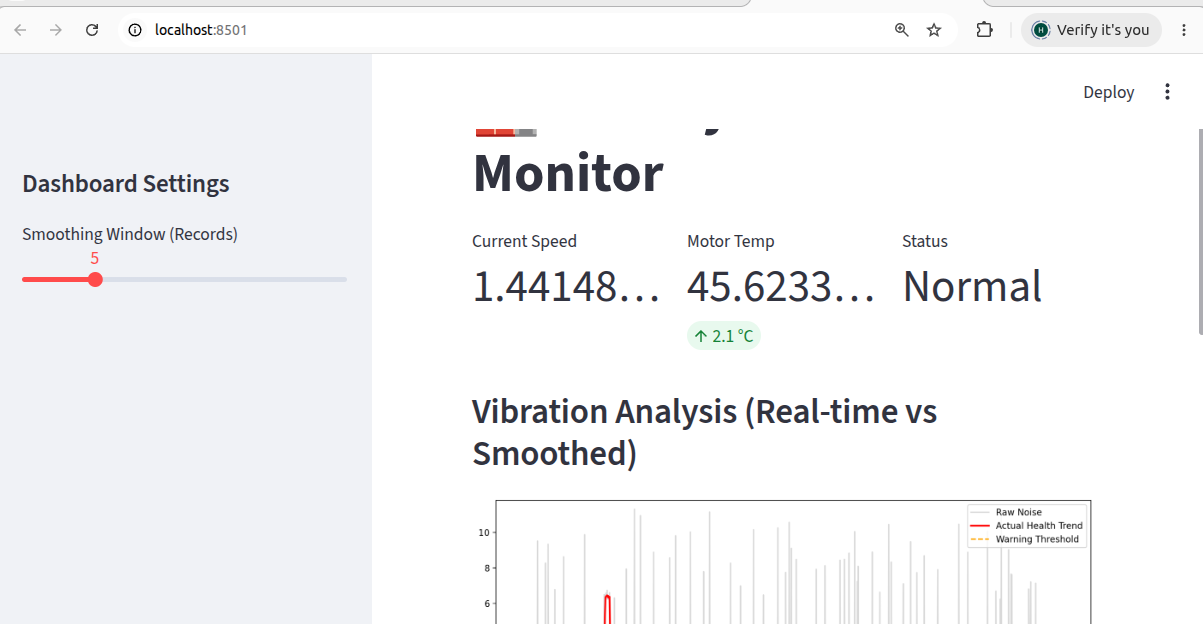
Live dashboard view: current speed, motor temperature, system status, and vibration analysis (raw noise vs. smoothed health trend with warning threshold).
AI Maintenance Assistant
Powered by Claude Haiku — translates sensor anomalies into plain-English maintenance guidance
What the Sensors Show
The conveyor belt is in critical condition with escalating problems over the last 8 minutes. Motor temp climbed to 86.6°C, vibration hit 6.14 (well above the 5.0 critical limit), and belt speed is dropping steadily.
Most Likely Root Cause
Bearing wear or misalignment in the motor/drive system. Rising temperature + increasing vibration + slight speed loss indicates internal friction building up.
Recommended Action
Stop the conveyor belt immediately. Continued operation risks motor seizure or bearing failure.
- Shut down the belt now and isolate from power.
- Inspect the motor bearings for excessive play or noise.
- Check motor-to-pulley alignment with a straight edge.
- Plan bearing replacement or realignment before restart.
Project Assets & Generated Datasets
Source files, simulation scripts, and generated datasets from the IoT layer of the Pawsome Provisions project. Stack: Python · NumPy · Pandas · Streamlit · Azure.
conveyor_iot_data.csv
Simulated conveyor belt sensor data — bearing speed, temperature, and vibration readings.
industrial_failure_dataset.csv
Base dataset with seeded failure conditions added to simulate real predictive maintenance scenarios.
messy_conveyor_data.csv
Dataset with common industrial data quality issues introduced — missing values, outliers, and noise — to simulate real-world IoT ingestion challenges.
plant_dashboard.py
Streamlit dashboard script. Extensible — alert outputs can be routed to email, SMS, or Microsoft Teams.
This single-plant view doesn't show the whole picture. Once Pawsome had sixteen plants — each depending on different regional infrastructure — a new problem showed up: not "is this plant healthy," but "which of these sixteen alerts are actually the same incident."
See How That Got Solved →