BI in Manufacturing & SQL Analytics
The fictional Pawsome Provisions pet food facility generates data at every layer — IoT sensors on the production floor, sales orders out the door, and inventory moving between them. This page covers the business intelligence layer: how fictional analyst Anna Analyst uses PostgreSQL, Docker, and Metabase to turn raw facility data into actionable insight.
Why this project exists
Most BI portfolios show a dashboard. This one shows the full pipeline that makes a dashboard meaningful — the schema design, the data generation, the containerised environment, and the analytical SQL that runs against it. The goal was to simulate how a real manufacturing operation surfaces business intelligence: not from a single tidy spreadsheet, but from multiple connected data sources that each tell a different part of the same story.
The dashboard runs in Metabase rather than Power BI or Tableau — deliberately. Real deployments rarely get to assume a customer's licensed BI stack; more often it's whatever's self-hosted, containerized, and already running. Metabase is self-hosted, connects directly to PostgreSQL, and produces real analytical output from standard SQL — the kind of constraint an engineer actually has to build inside, not around. It also makes the handoff between engineer and analyst explicit: the engineer owns the schema, the analyst owns the questions.
The Facility Data Stack
Three connected layers, each telling a different part of the same story.
OT / IoT Layer
Conveyor belt sensors — bearing speed, temperature, vibration
Inventory Layer
Stock levels, reorder thresholds, depletion vs. production rate
Sales Layer
Orders, revenue, product mix, regional distribution
BI Dashboard
Metabase — Anna Analyst's single pane of glass
The Analytics Stack
A fully local, containerised BI environment — from raw data to interactive dashboard. Stack: Python · PostgreSQL · Docker · Metabase · Azure.
🗄️ PostgreSQL
Sales, inventory, and reorder data live in a normalised PostgreSQL schema. Three related tables give Anna meaningful joins to work with — a step beyond single-table queries and closer to real-world database work.
🐳 Docker
Metabase runs in a Docker container connected to the PostgreSQL instance. This two-container setup mirrors realistic local analytics deployments — portable, reproducible, and easy to rebuild from scratch.
📊 Metabase
Anna Analyst uses Metabase's question builder and SQL editor to explore data and build dashboards — demonstrating the real-world handoff between the engineer who owns the schema and the analyst who owns the questions.
The Product Catalogue
Pawsome Provisions produces eight SKUs across dry food, wet food, and treat lines — each with its own sales velocity, reorder threshold, and stock behaviour.
| SKU | Product Name | Category | Unit Weight | Reorder Point (units) | Current Stock | Status |
|---|---|---|---|---|---|---|
| PPF-001 | Chicken & Brown Rice Kibble | Dry Food | 5 kg | 500 | 1,240 | Healthy |
| PPF-002 | Senior Blend Dry Food | Dry Food | 5 kg | 300 | 288 | Low |
| PPF-003 | Salmon & Sweet Potato Kibble | Dry Food | 5 kg | 400 | 870 | Healthy |
| PPW-001 | Beef Stew Wet Food | Wet Food | 400 g | 800 | 212 | Critical |
| PPW-002 | Tuna & Pumpkin Pâté | Wet Food | 400 g | 600 | 945 | Healthy |
| PPW-003 | Lamb & Vegetable Casserole | Wet Food | 400 g | 500 | 480 | Low |
| PPT-001 | Dental Chew Treats | Treats | 200 g | 1,000 | 2,310 | Healthy |
| PPT-002 | Freeze-Dried Liver Bites | Treats | 150 g | 700 | 690 | Low |
Database Schema
Three related tables give Anna Analyst a normalised foundation for meaningful joins.
sales
One row per order line — SKU, quantity, unit price, order date, and region code.
CREATE TABLE sales (
    sale_id       SERIAL PRIMARY KEY,
    sku           VARCHAR(10) REFERENCES inventory(sku),
    quantity      INTEGER,
    unit_price    NUMERIC(6,2),
    order_date    DATE,
    region        VARCHAR(20)
);
inventory
Current stock levels, reorder thresholds, and max capacity per SKU.
CREATE TABLE inventory (
    sku               VARCHAR(10) PRIMARY KEY,
    product_name      VARCHAR(100),
    category          VARCHAR(20),
    current_stock     INTEGER,
    reorder_threshold INTEGER,
    max_capacity      INTEGER,
    last_restocked    DATE
);
reorder_log
A running log of reorder events — when stock fell below threshold, how much was ordered, and expected delivery.
CREATE TABLE reorder_log (
    log_id            SERIAL PRIMARY KEY,
    sku               VARCHAR(10) REFERENCES inventory(sku),
    triggered_date    DATE,
    quantity_ordered  INTEGER,
    expected_delivery DATE,
    fulfilled         BOOLEAN DEFAULT false
);
Anna Analyst's SQL Queries
Four business-logic queries that demonstrate practical SQL skills — not just SELECT *.
1. Stock Turnover Rate by SKU
How fast is each product moving relative to average stock on hand? Higher = faster-selling.
-- Units sold in June 2025 divided by average inventory level
SELECT
    s.sku,
    i.product_name,
    SUM(s.quantity)                        AS units_sold,
    i.current_stock                        AS stock_on_hand,
    ROUND(
        SUM(s.quantity)::NUMERIC / NULLIF(i.current_stock, 0), 2
    )                                      AS turnover_rate
FROM sales s
JOIN inventory i ON s.sku = i.sku
WHERE s.order_date BETWEEN '2025-06-01' AND '2025-06-30'
GROUP BY s.sku, i.product_name, i.current_stock
ORDER BY turnover_rate DESC;
2. Products At or Below Reorder Threshold
Immediate visibility into which SKUs need attention — the basis for Anna's stock alert panel.
SELECT
    sku,
    product_name,
    current_stock,
    reorder_threshold,
    CASE
        WHEN current_stock = 0                       THEN 'Out of Stock'
        WHEN current_stock < reorder_threshold * 0.5 THEN 'Critical'
        ELSE                                               'Low'
    END AS stock_status
FROM inventory
WHERE current_stock <= reorder_threshold
ORDER BY current_stock ASC;
3. Days of Stock Remaining (Based on Sales Velocity)
Uses recent average daily sales to project how many days before each SKU runs out.
WITH daily_sales AS (
    SELECT
        sku,
        SUM(quantity) / COUNT(DISTINCT order_date) AS avg_daily_units
    FROM sales
    WHERE order_date >= CURRENT_DATE - INTERVAL '30 days'
    GROUP BY sku
)
SELECT
    i.sku,
    i.product_name,
    i.current_stock,
    ROUND(d.avg_daily_units, 1)             AS avg_daily_units,
    ROUND(
        i.current_stock / NULLIF(d.avg_daily_units, 0), 0
    )                                      AS days_remaining
FROM inventory i
JOIN daily_sales d ON i.sku = d.sku
ORDER BY days_remaining ASC;
4. Revenue by Product Category with Stock Health
Combines sales revenue and inventory status in one view — useful for prioritising restocking decisions.
SELECT
    i.category,
    SUM(s.quantity * s.unit_price)         AS total_revenue,
    SUM(s.quantity)                        AS units_sold,
    COUNT(DISTINCT CASE
        WHEN i.current_stock <= i.reorder_threshold THEN i.sku
    END)                                   AS skus_needing_reorder
FROM sales s
JOIN inventory i ON s.sku = i.sku
WHERE s.order_date BETWEEN '2025-06-01' AND '2025-06-30'
GROUP BY i.category
ORDER BY total_revenue DESC;
Anna Analyst's Dashboard
Interactive dashboard built in Metabase — sales, inventory health, and reorder alerts in one view.
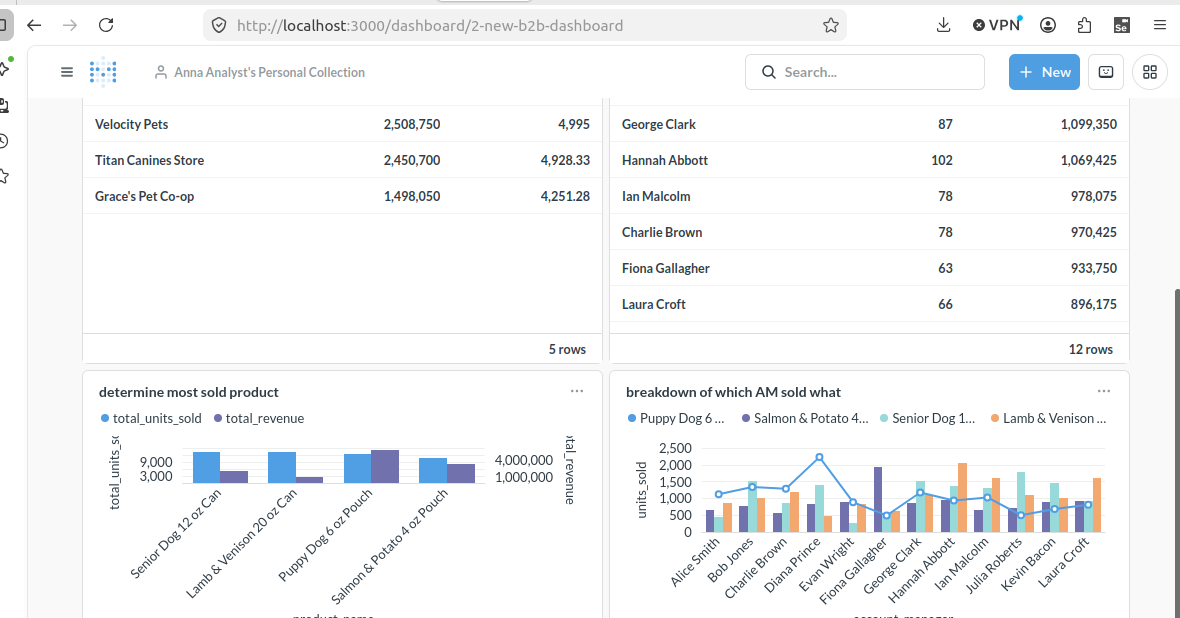
June 2025 Sales & Inventory Dashboard
Monthly sales volume, product line revenue breakdown, and stock health — all built in Metabase using SQL questions connected to the PostgreSQL backend.
Part of a Larger Story
This page is the BI layer of the Pawsome Provisions multi-layer data engineering project.
🏭 Plant Floor → Operational Technology
The conveyor belt simulation generates IoT sensor data — bearing speed, temperature, and vibration — feeding a real-time Streamlit dashboard for plant managers monitoring equipment health and predictive maintenance signals.
📈 BI Layer → This Page
Sales, inventory, and reorder data sit in PostgreSQL. Anna Analyst queries across all three tables to surface stock risk, revenue trends, and fulfilment pressure — the business view above the production floor.
Project Assets
Source files, datasets, and configuration used in the BI pipeline.
b2b_sales_data.csv
Fictional Pawsome Provisions sales data for June 2025, loaded into PostgreSQL.
inventory_snapshots.csv
Initial inventory levels and reorder thresholds for all eight Pawsome Provisions SKUs.
load_to_postgres.py
Python script used to create the schema and load sales and inventory data into PostgreSQL.
docker-compose.yml
Docker Compose configuration for the Metabase + PostgreSQL containerised environment. Written and tested on Ubuntu 22.04 — adjust as needed for your local OS.